
Executive Director Letter
March 2023
Dear Community Member,
Since 2008, the Washington Health Alliance has been reporting on the quality of care in our state, and we continue to endeavor to add impactful insights into the Community Checkup to better help purchasers, health plans, and providers understand where they can collectively begin to tackle health care challenges.
This year we introduce new components to understand how the neighborhood you live in can impact your health and to highlight the importance of having a primary care provider.
The Alliance remains committed to transparency and trusted, credible reporting on healthcare quality, cost, and value. Our reporting relies on a voluntary All-Payer Claim Database, covering more than 4 million Washington residents, well over 50% of the state’s population having commercial insurance or Medicaid coverage. These claims, from Jan. 1 through Dec. 31, 2021, show results from all the Accountable Communities of Health (ACH), more than 1,900 clinics, 300 medical groups, 100 hospitals, 16 health plans, and all 39 counties in Washington.
New this year, we have introduced the lens of equity to help sharpen the focus on where actions can yield tangible results. Leveraging the Neighborhood Atlas (the Area Deprivation Index or ADI), a tool validated by the University of Wisconsin School of Medicine and Public Health, we are reporting for the first time that all too often our least advantaged neighborhoods receive a substantively lower quality of care.
Where you live matters. For example, if you live in a more socioeconomically disadvantaged area, you may not be receiving cancer screenings at the same rate compared to those in more privileged areas. Similarly, less than 40% of commercially insured children get appropriate well-care visits when they live in more disadvantaged locations.
Do you really need a primary care provider? The quick answer is yes! This is the first year we report quality results for people who have claims but do not have an attributed primary care provider (PCP). For Washingtonians without a PCP, the ability to receive the appropriate care is significantly inadequate. For example, of commercially insured women without a PCP, only 36% receive recommended breast cancer screening. For those with a PCP, that rate can go as high as 91%, almost a three-fold difference.
Clinical care across the country was impacted by the Covid-19 pandemic. However, clinical processes and outcomes as reported by the National Committee for Quality Assurance continue to improve nationally. Unfortunately, those same measures of quality in Washington have mostly remained flat in comparison. While we aspire to rank at or above the national 90th percentile, we find ourselves below the 50th percentile on more than 70% of these measures. The health care system failing Washingtonians on dozens of quality measures that could dramatically improve their health, allowing people to contribute to their communities, remain productive in their jobs and improve the affordability of care overall.
It is well documented that almost half of families are having significant difficulty with the costs of healthcare. High-quality care is paramount; however, it must come at a reasonable cost. Families should not have to choose between housing, transportation, food, and healthcare. Too often, delays in care are due to the financial rationing choices that people are forced to confront. Health care value means we have a system that delivers appropriate, high-quality care at a reasonable cost that is also affordable for families. Failure to do so will further widen the care gap that most often impacts our vulnerable communities.
We all have a lot of work ahead of us to catalyze change in Washington’s health care system. This must be a collective effort. It begins with everyone making a choice to change.
Sincerely,

Drew Oliveira, MD, MHA
Executive Director
Washington Health Alliance
Comparing Washington State With National Benchmarks
The Community Checkup measures the quality of health care delivered across Washington state and compares metrics related to performance nationally using the Healthcare Effectiveness Data and Information Set (HEDIS) reported by the National Committee for Quality Assurance (NCQA).1
HEDIS is a comprehensive standardized performance measurement process that is widely accepted as an industry standard. National benchmarks are based on health care delivered to approximately 191 million people enrolled in commercial and Medicaid plans across the country and is used by more than 90% of health plans to measure and report performance to purchasers and consumers. Comparing Washington state’s results with the national HEDIS results allows us to track progress toward the shared goal of providing care in the top 10% of performance nationally.
The figures summarize how well Washington state results compare with national benchmarks as follows:
- at or above the national 90th percentile in dark green,
- between the 75th and 90th percentile in light green,
- between the 50th and 75th percentile in gray,
- between the 25th and 50th percentile in yellow, and
- below the 25th percentile in red.2
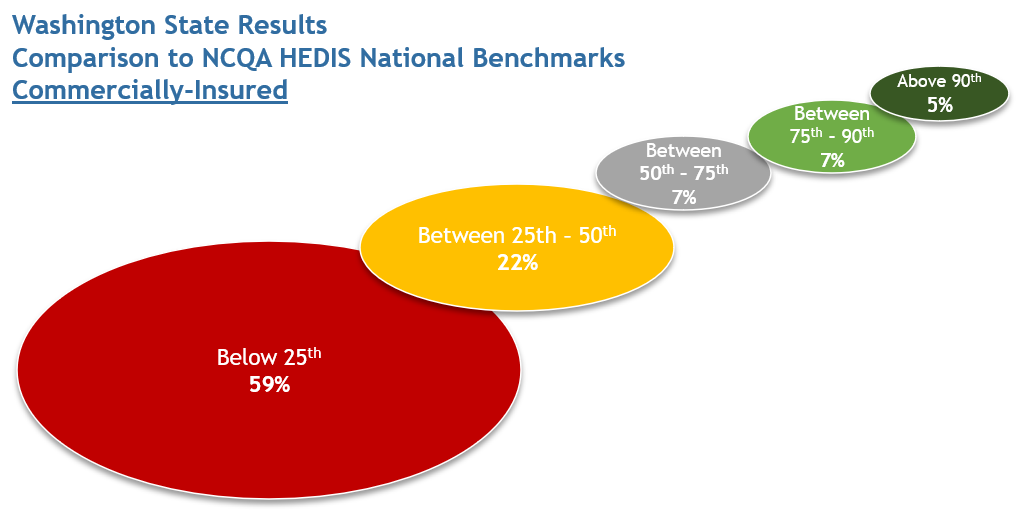
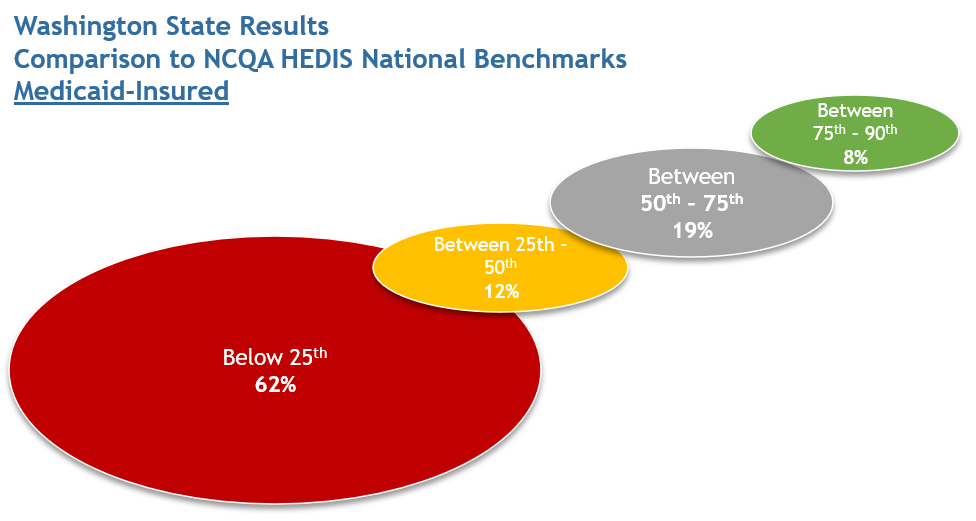
The results in this report are fairly consistent with past releases. The majority of measures in Washington state are below the national 50th percentile: 81% for the commercially insured and 74% for the Medicaid-insured. For both populations, Washington state performed above the national 90th percentile on only one measure: appropriate treatment for upper respiratory infection (Total). That measure reports on the number of health plan members over 3 months-old who went to a doctor for a common cold and who were not prescribed an antibiotic for 3 days after the diagnosis.
Clinic Quality Performance Ranking
Where you access healthcare can have a significant impact on the quality of care you receive. The latest results indicate that even though there are clear evidence-based guidelines, there is substantial variation in the quality of care delivered to patients. Disparities plainly exist by county, medical groups, and among hundreds of clinics throughout the state.
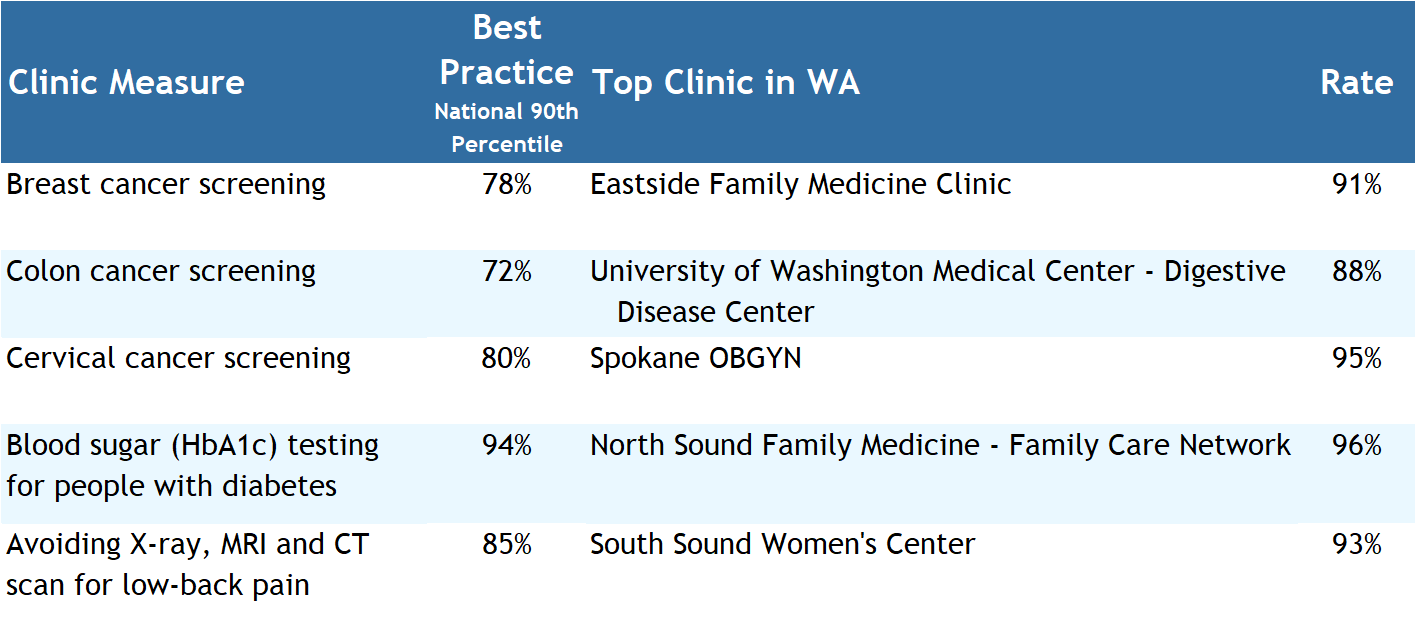
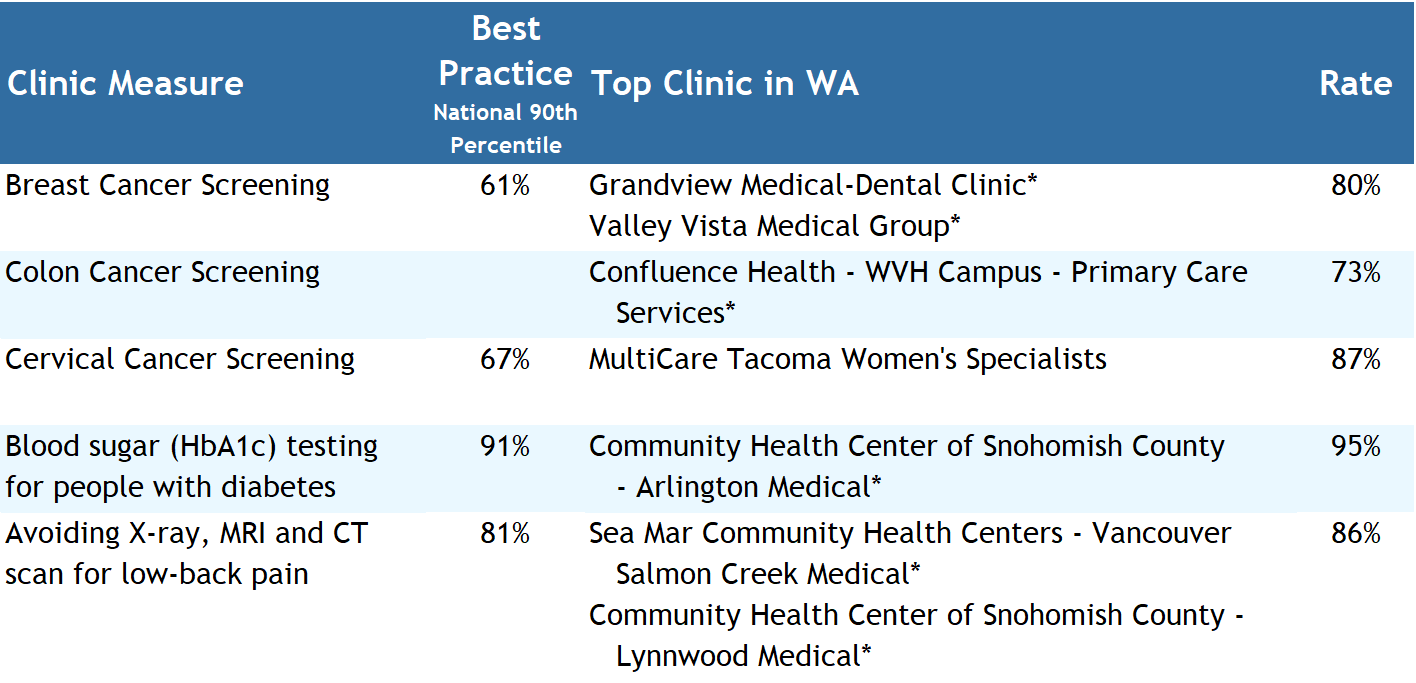
From the Variation in Health Care Quality Highlight, the Alliance selected five measures where achieving high performance can prevent serious disease, improve the overall quality of treatment, or avoid unnecessary and costly care: breast cancer screening, colon cancer screening, cervical cancer screening, blood sugar (HbA1c) testing for people with diabetes, and avoiding X-ray, MRI and CT scans for low-back pain.
The Washington Health Alliance would like to celebrate the highest-performing clinics across Washington that not only exceed the National 90th Percentile benchmark but set the bar for excellence in performance.
The Alliance applauds the efforts of these clinics on these measures as we all work together to improve the quality and affordability of care in Washington state.
Best In Class Quality - Commercial Insured
Best In Class Quality - Medicaid Insured
Quality Results by Area Deprivation Index
It has long been understood that where someone lives can have a substantial impact on the quality of life, the care received, and their length of life. Health is impacted through physical factors (air and water quality and transportation), health behaviors, and social and economic variables. This is the first large-scale report in Washington state to show that where you live determines, in many cases, the care you receive.
The Alliance has applied our quality results to the Area Deprivation Index (ADI), a tool developed by the University of Wisconsin’s School of Medicine and Public Health, to show how an individual is advantaged or disadvantaged based on where they live and the quality of care received.
We cannot impact quality in healthcare without first addressing social inequities. While not universal or limited to the type of medical coverage, an individual’s advantage or disadvantage can directly impact the quality of care they receive even when they have an established source of primary care. For example, individuals with a commercial insurance plan living in the most advantaged areas received breast cancer screenings at a rate of 75%, while those in the least advantaged areas received a screening at a rate of only 61% For this measure, the performance of the National 90th percentile is 78%.
Another example of a similar impact is for well-care visits for children ages 3 to 11. Children with commercial insurance in the most advantaged areas of our state receive these visits at a rate of 65%. This rate drops to 50% for those children in the least advantaged areas.
Barriers to care, such as inadequate transportation, education levels, limited finances, unemployment, and access to medical care are prevalent across Washington and the clinical impact is concerning. These barriers can lead to substantial gaps in care such as access to appropriate preventative care like cancer screenings, or lead to inappropriate and costly treatment. Understanding that inequities exist across our communities is the first step toward crafting meaningful, lasting strategies to ensure that high-quality, affordable care. As we work to address these barriers to close the gaps, we will glean powerful insights that can benefit all Washingtonians.
There is a clear call to action for healthcare providers, health plans, and healthcare purchasers to focus on the task of recognizing implicit bias, addressing inequities in specific communities, engaging the healthcare supply chain, and aligning expectations to guarantee the level of quality care that is consistent and sustainable across the entire population. Plans, providers, and purchasers need to work together to identify the barriers to care, implement multi-faceted solutions, and actively measure the results. We as a community should not accept that your care is tiered because of where you happen to live,
Total Cost of Care
Understanding the cost of health care is an important metric to gauge the value a patient receives. This becomes even more important when we look at some of the socioeconomic barriers to care that impact access including an individual’s ability to afford appropriate, quality care.
However, the total cost of services has long been unreported. For the second year, the Alliance is publishing the average cost by medical group and clinic, county, and Accountable Community of Health. The costs are broken into five major categories – hospital inpatient, hospital outpatient, professional, prescription drug, and ancillary costs.
This map shows the average risk-adjusted cost per member per month for commercial insurance across Washington’s 39 counties. The shading shows the county’s performance relative to the state average, so Garfield County, with a darker green shade and an average cost of $407 is more favorable than the state average. Clallam County, with a darker red shade and an average cost of $601 is less favorable than the state average.
The high cost of health care is a burden on U.S. families, with 47% of families finding it difficult to afford their health care costs. Identifying costs and trends is a powerful management tool for purchasers and health plans to identify opportunities to contract differently, create centers of excellence, steer members to more affordable options, leverage reference-based pricing models, adjust plan designs, etc. Providers in value-based arrangements may identify different referral options at a lower cost for the same service or voluntarily lower their pricing to gain market share.
Through this understanding of how money is being spent, efforts can be made to strategically break longstanding cost trends. Failure to do so will result in delays in access to care, decreased the ability to close clinical gaps in care and ultimately result in higher cost care that could have been avoided.
Health Care Spending by Washington State
Why is it important to measure health care spending?
The cost of a good or service is one of the primary pieces of information consumers use to assess value and inform their purchasing decisions. However, when it comes to the cost of health care, accurate information about the cost of a treatment or procedure is often not available in advance. Not only do consumers often have difficulty gathering accurate price information, but costs can vary significantly between facilities. This lack of price transparency makes it impossible for consumers to make informed decisions about how to spend their health care dollars in order to get the best value.
In the state of Washington, as in much of the rest of the nation, we are only at the dawn of price transparency. Over time, with more collaborations among stakeholders, we expect to see greater transparency of health care costs in our state. In the meantime, the state, as the largest purchaser of health care, is doing its part to encourage transparency by reporting what it is spending to purchase health care and by continuing to look for opportunities to slow the rate of spending growth.
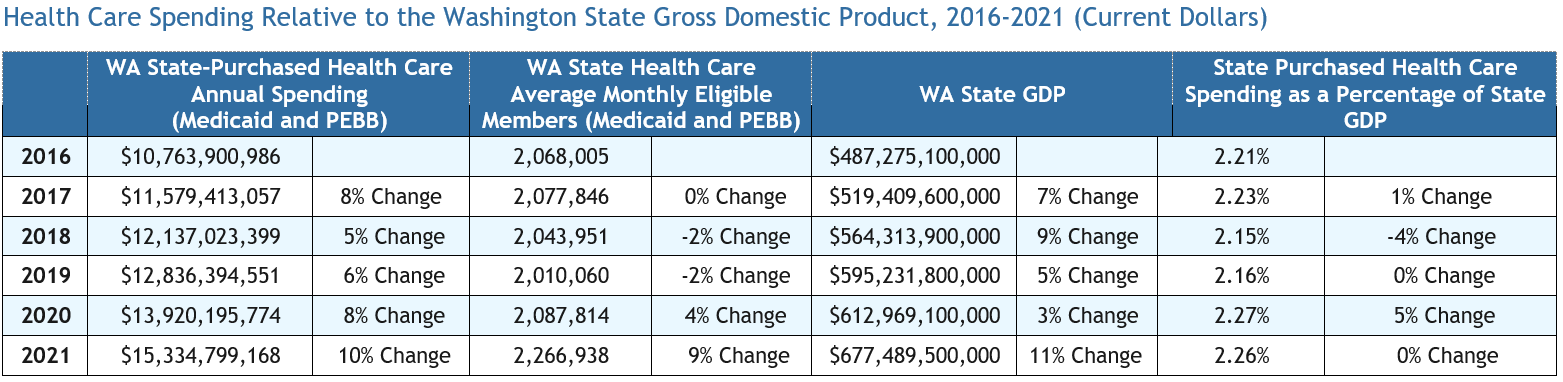
Annual per-capita state-purchased health care spending growth relative to state gross domestic product
The table below reports on the Washington state-purchased health care annual spending for Medicaid and Public Employees Benefits Board (PEBB) as a percentage of Washington state gross domestic product (GDP) for a six-year period (2016–2021).3 For each year, the denominator is that year’s GDP and the numerator is the amount spent by the state on health care that year. Percentages reflect year-over-year changes.
A Call to Action
The 2023 Community Checkup report raises tough questions, not just about disparities in quality and cost statewide, but on the socioeconomic barriers that are keeping residents from receiving appropriate care. If we continue with the status quo, the data suggests we will continue to lose ground on the quality of care in our communities. We have not been making tough choices if we want change.
The 2023 Community Checkup highlights five key findings.
- The quality measures of primary care in Washington are well below the national average.
- The lack of a primary care provider (PCP) is a clear contributing factor in not receiving appropriate quality care.
- Having a PCP is associated with improved quality and fewer care gaps.
- Where you live may impact the quality of care and appropriate services you receive.
- The cost of care appears to be independent of quality, though very dependent on location
So, it is time to make a choice.
Together, we can choose to correct these problems through collective effort. All our stakeholders – healthcare providers, health plans, employers and other purchasers must be involved in the solution. Here are some opportunities:
Health Care Purchasers
- Choose to no longer purchase mediocre care.
- Designate networks that deliver quality and affordability.
- Require PCP assignment.
- Expect solutions to health inequities from plans and providers.
- Support alternative payment models that limit financial exposure and deliver quality.
- Use centers of excellence for better diagnosis, outcomes and pricing.
Health Plans
- Implement value-based contracting targeting equity improvement.
- Favor plan designs that require PCP assignment.
- Contract to address populations with no PCP and/or no claims.
- Finance alternative payment models to accountable provider organizations.
- Address hospital quality, safety, and pricing.
- Steer members to centers of excellence for both quality and cost reductions.
- Steer members away from practices not organized for accountability.
Providers
- Become accountable for the full population of patients on quality and costs.
- At a minimum, quality should be at the national 50th percentile within three years.
- Prepare to compete on quality, affordability, and member experience.
- Understand the value of alternative payments and lead implementation away from fee-for-service medicine.
Washington Health Alliance
- Engage the purchaser community bringing transparent options, learnings from best practices resulting in an action-oriented response.
- Expand measurement and insights on health inequities to drive quality improvement.
- Bring together providers to learn and collaborate with higher performers.
- Expect average clinical performance within 3 years from PCP practices.
- Provide additional insights to variations within health plans, purchasers and providers.
About the Washington Health Alliance
The Washington Health Alliance (Alliance) is a 501(c)(3) nonprofit nonpartisan organization working collaboratively to transform Washington state’s health care system for the better. The Alliance brings together more than 185 committed member organizations to improve health and health care by offering a forum for critical conversation and aligned efforts by health plans, employers, union trusts, hospitals and hospital systems, health care professionals, start-up companies, consultants, consumers, and other health care partners. The Alliance believes strongly in transparency and offers trusted and credible reporting of progress on health care quality, value, pricing, and overall spending. The Alliance publishes its reports at www.WACommunityCheckup.org and provides guidance for consumers at www.OwnYourHealthWA.org so that individuals can make informed health care decisions.
How to Contact Us
Please direct questions about the Washington Health Alliance or the Community Checkup report to:
Drew Oliveira, MD, MHA
Executive Director
Phone: 206-448-2570
Email: doliveira@wahealthalliance.org
Sharon Eloranta, MD
Medical Director, Performance Measurement and Practice Transformation
Phone: 206-448-2570
Email: seloranta@wahealthalliance.org
Mark Pregler
Director of Data Management and Analytics
Phone: 206-448-2570
Email: mpregler@wahealthalliance.org
Denise Giambalvo
Director, Member Engagement & Business Strategy
Phone: 206-448-2570
Email: dgiambalvo@wahealthalliance.org
Footnotes
- National Committee for Quality Assurance, HEDIS and Performance Measurement, https://www.ncqa.org/hedis/.
- Washington Health Alliance, Community Checkup, 2023 Technical Specifications, https://www.wacommunitycheckup.org/about/methodology/.
- This information is provided by the Washington State Health Care Authority. WA State GDP data are from the U.S. Bureau of Economic Analysis. Medicaid expenditures and eligible member counts are estimated based on data from CMS 64 reporting, Agency Financial Reporting System, and February 2022 Health Care Authority Expenditure Forecast. Medicaid Expenditures include medical, dental, vision, pharmacy, long-term support services, mental health, and substance use disorder expenditures; and excludes Medicare Part D Co-Pay/Clawback and Medicare Part A/B Premiums. PEBB data for calendar years 2014-2015 is from Milliman PFPM 3.0 (5/11/2016); data for calendar year 2016 is from Milliman PFPM 6.0, (02/14/2017); data for calendar year 2017 is from Milliman PFPM 2.0 (02/09/2018); data for calendar year 2018 is from Milliman PFPM 7.0 (05/29/2019); data for calendar years 2019-2021 is from Milliman PFPM 4.0 (09/23/2022).