2021
Highlight : Health Care Spending in Washington State
Why is it important to measure health care spending?
The cost of a good or service is one of the primary pieces of information consumers use to assess value and inform their purchasing decisions. However, when it comes to the cost of health care, accurate information about the cost of a treatment or procedure is often not available in advance. Not only do consumers often have difficulty gathering accurate price information, but costs can vary significantly between facilities. This lack of price transparency makes it impossible for consumers to make informed decisions about how to spend their health care dollars in order to get the best value.
In the state of Washington, as in much of the rest of the nation, we are only at the dawn of price transparency. Over time, with more collaborations among stakeholders, we expect to see greater transparency of health care costs in our state. In the meantime, the state, as the largest purchaser of health care, is doing its part to encourage transparency by reporting what it is spending to purchase health care and by continuing to look for opportunities to slow the rate of spending growth.
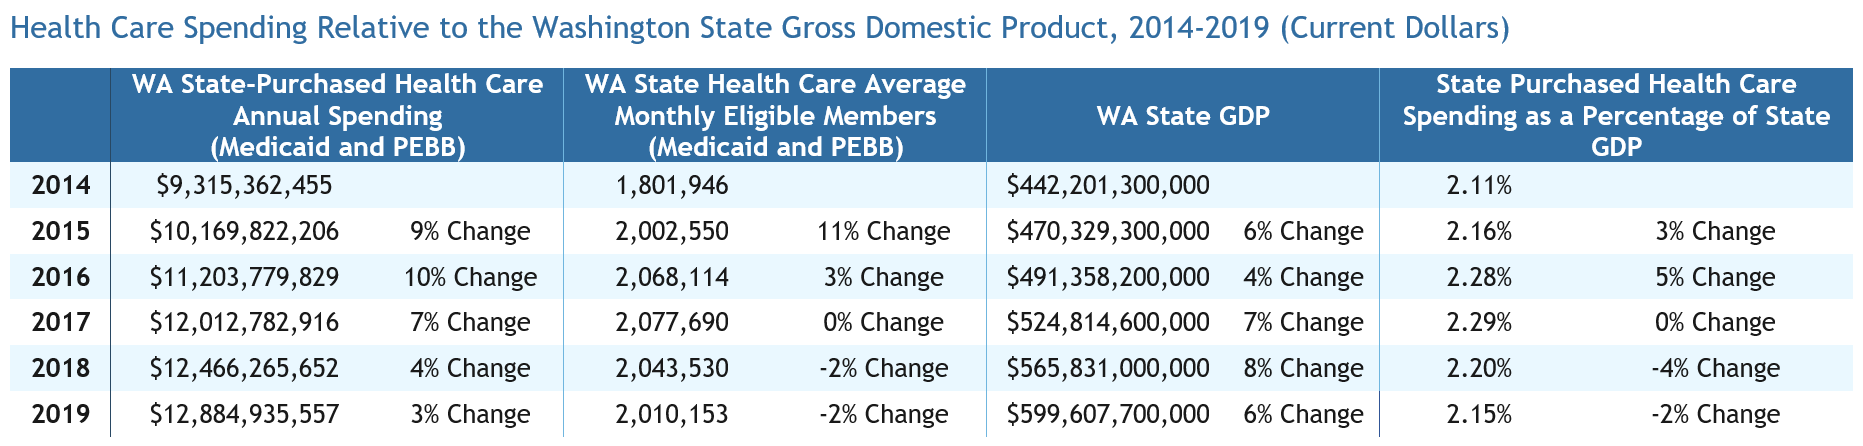
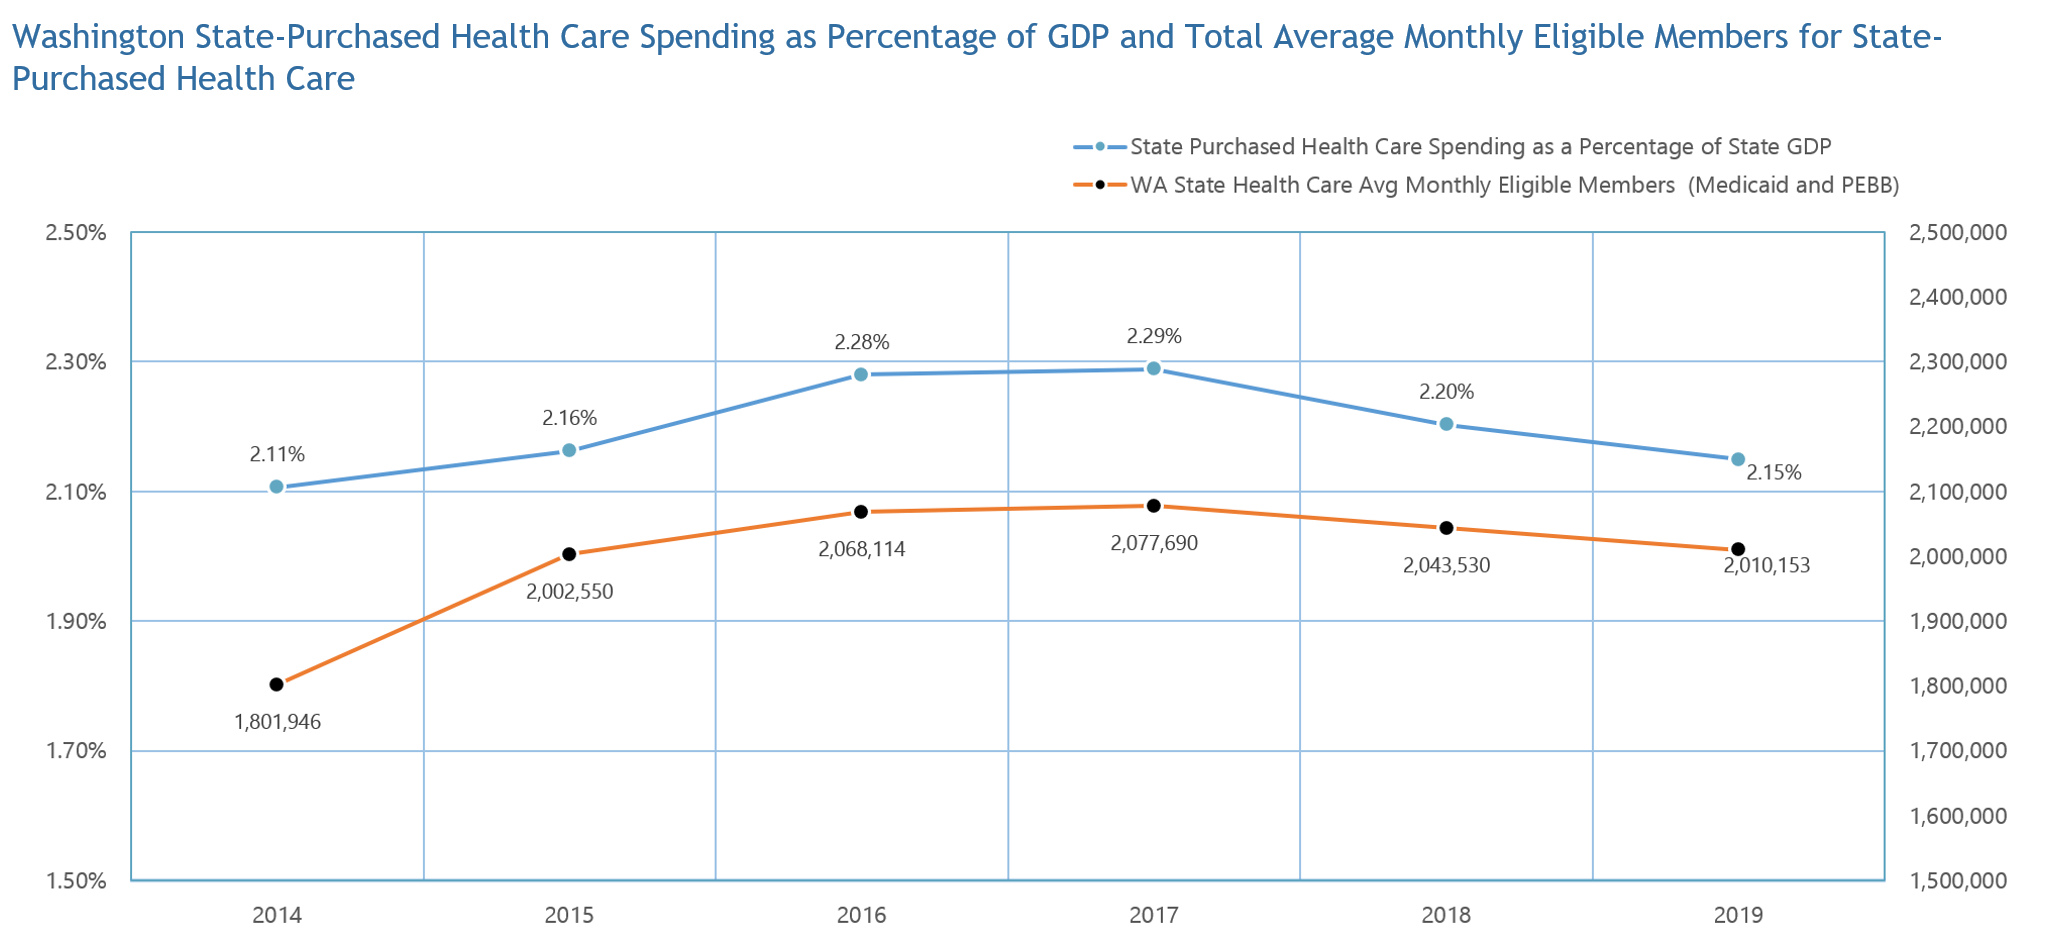
Annual per-capita state-purchased health care spending growth relative to state GDP
The table below reports on the Washington state-purchased health care annual spending [Medicaid and Public Employees Benefits Board (PEBB)] as a percentage of Washington state gross domestic product (GDP) for a six-year period (2014–2019).1 For each year, the denominator is that year’s GDP and the numerator is the amount spent by the state on health care that year. Percentages reflect year-over-year changes.
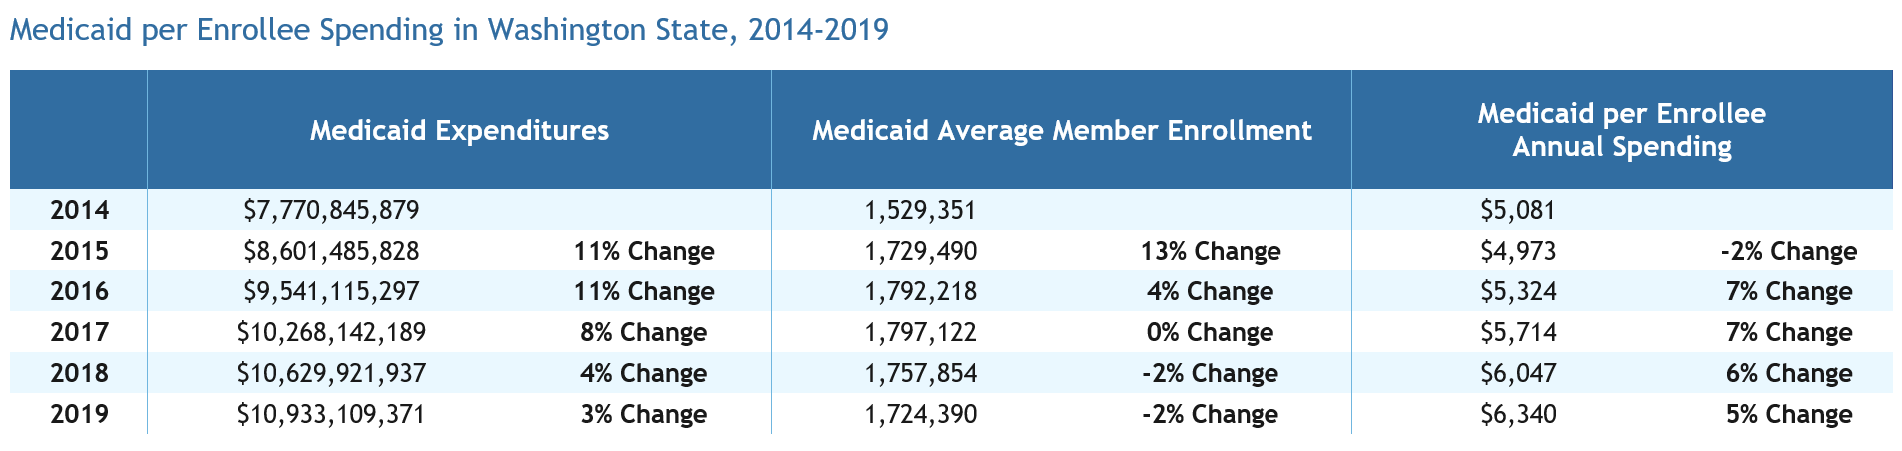
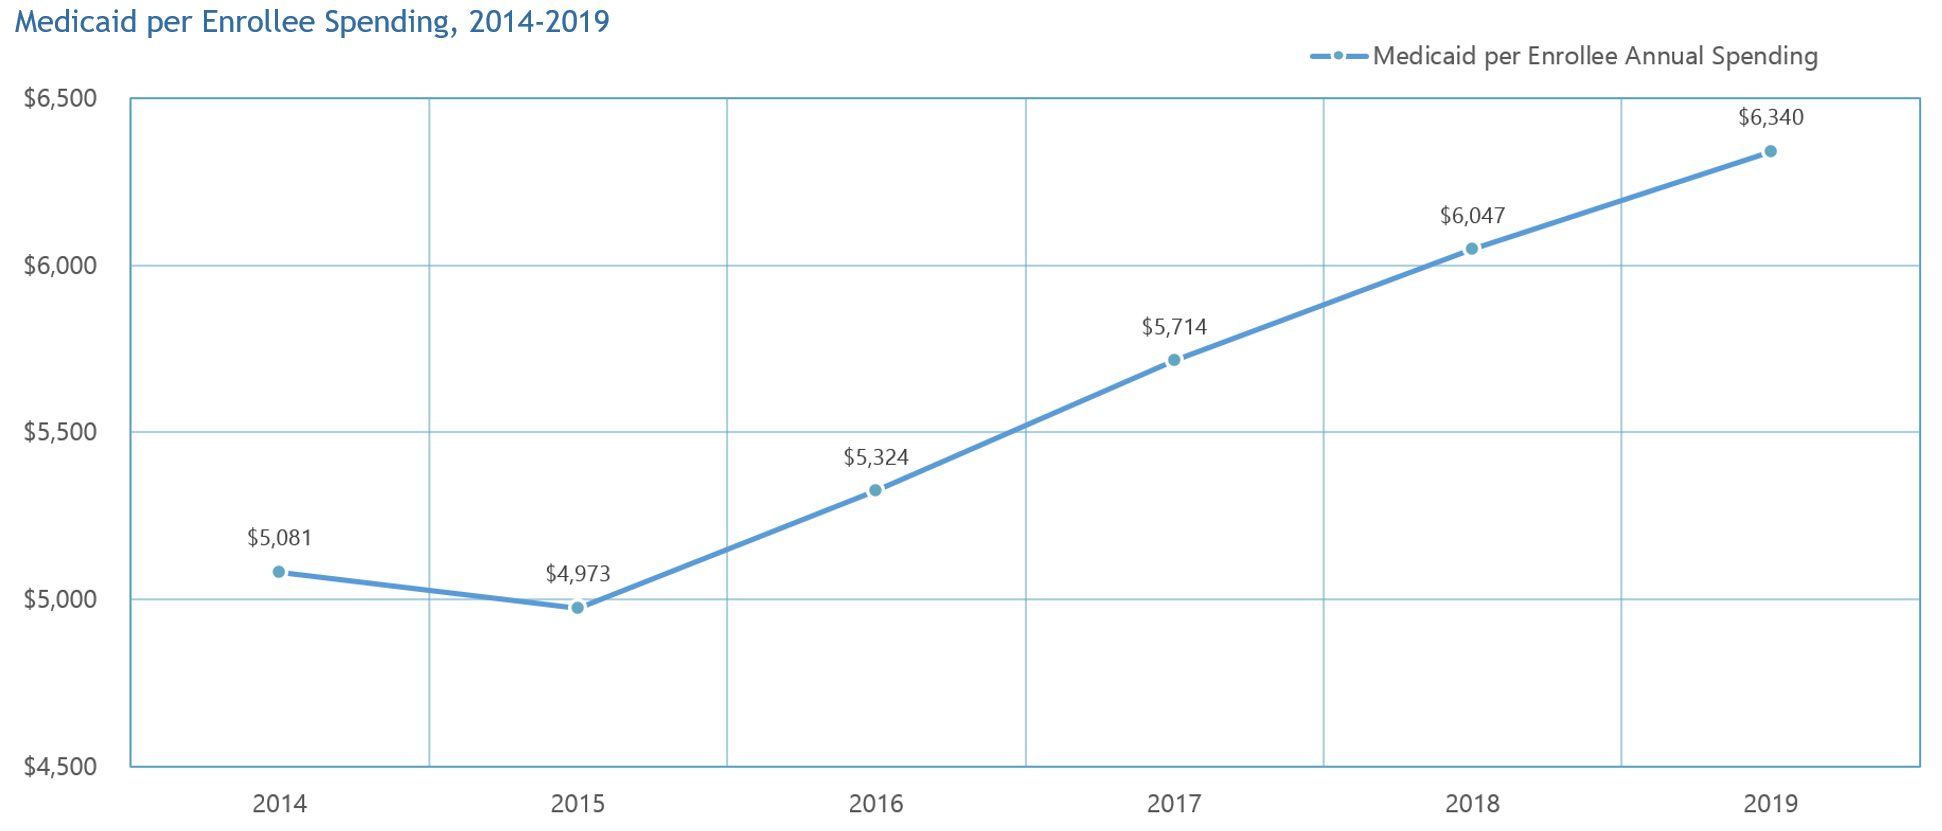
Medicaid per enrollee spending
The table below reports on annual Medicaid spending per enrollee and includes both state and federal Medicaid payments.2 These figures represent the average level of payments across all Medicaid enrollees during a calendar year.
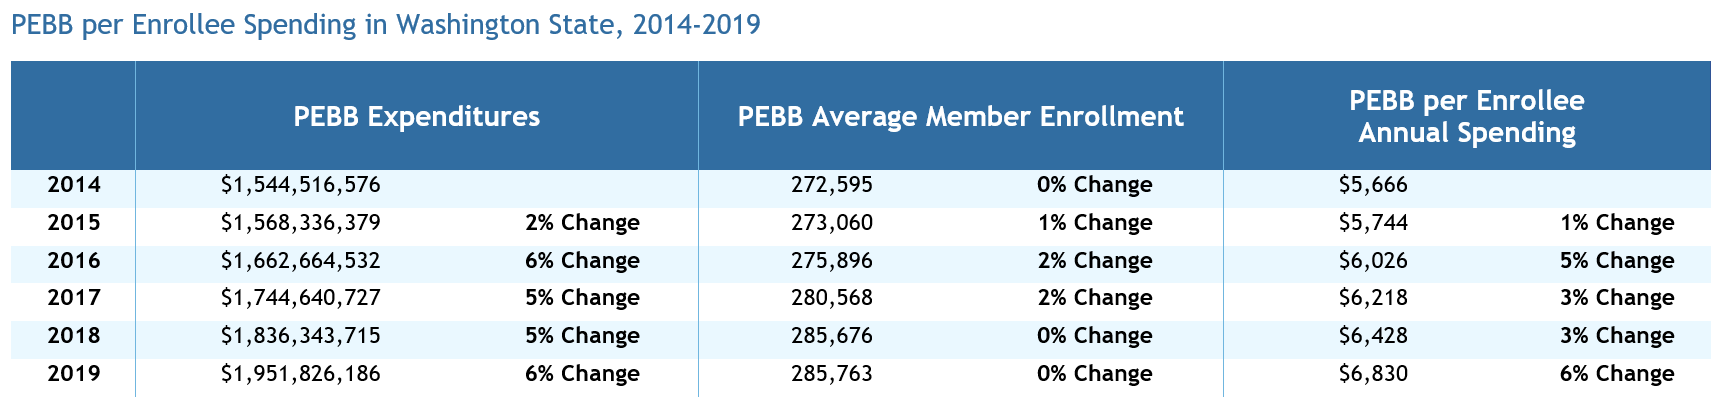
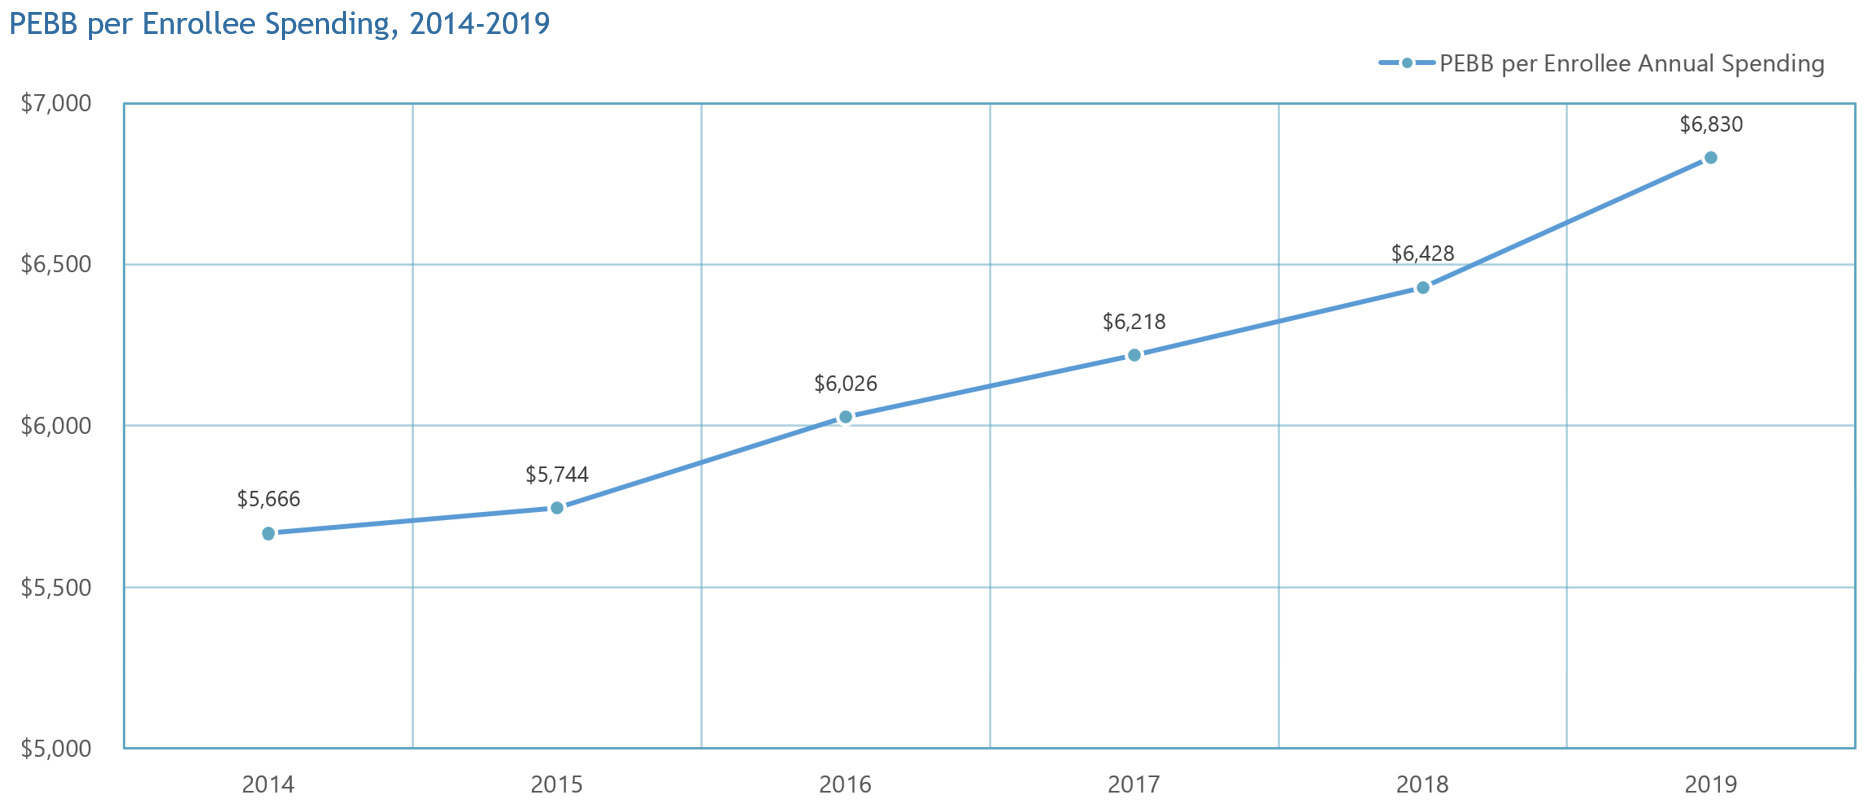
Public employee per enrollee spending
The table below reports on annual Public Employee Benefit (PEBB) spending per enrollee. Calculations represent the average (mean) level of payment across all PEBB enrollees, during a calendar year, based on date of payment.3